Software Usage Intelligence
Our client provides a cloud-based platform that helps leading software vendors gain insight into how their solutions are being used. Specifically, the platform enables detecting which features are used most and least, visualise user paths, and see what challenges they face. This data allows software companies to know what really matters to end users in order to supply a more valuable product.
The client was maintaining an existing intelligence solution basically aimed at desktop applications. The client’s idea was to create a brand-new on-premises solution for both web and desktop applications using a newer technology stack. The buyers of the solution were expected to be able to integrate it into their products to obtain information on how users interact with them, what features they use and how exactly this process takes place. The expected system needed to be easy to install, maintain and update. Also, the system had to be flexible and allow for various metrics from client applications to be gathered and used afterwards when building reports.
At first glance, it was apparent that the system needed to be divided into server components, clients and SDK components. A requirement was to provide JavaScript- and C-language-based SDKs that would work identically to the same API endpoints. The server API had to support the client’s SDK components, consume incoming data and build predefined and custom reports. The client UI component was required to display report data in charts with various custom settings.
Client SDK Components
A web-based SDK component was built using pure JavaScript and ECMAScript-5 to cover almost all possible browsers. A C-language dynamic link library was developed to support desktop applications. Both components have zero tolerance for errors; any error must be caught before it can crash the host application. Therefore, the components handle all errors inside and return a result indicating whether the operation was successfully completed.
Storage
Storage has been divided into relational and nonrelational databases. The relational database is used in the regular way to store information such as user credentials, preferences, report structures and their settings and filters. PostgreSQL was the simple choice to cover everything we needed on this front.
Choosing which nonrelational data engine to use was not easy. After an investigation, we agreed to use the time series database InfluxDB to store incoming event data. The schemaless approach seemed very attractive, as the client application could send undetermined data, and we were required to store it all. We implemented a proof-of-concept, and it worked well on smaller volumes of data. However, once we created performance tests, it became clear that InfluxDB could not handle our workload profile.
After some further investigation, we settled on ClickHouse. It is a column-oriented database, but it uses a strict schema, unlike InfluxDB. Therefore, we created a bunch of general-purpose columns that clients must bind to the metrics they gather. ClickHouse has demonstrated high performance under the required workload profile.
Server-Side Components
Two dedicated server-side components were created. One of them accepts, validates and normalises incoming event data before finally pushing it to ClickHouse via an intermediate buffer. Another component is responsible for the authentication/authorisation of users, handling incoming requests for reports, building the reports and sending them to the UI component. Both server components share ClickHouse and PostgreSQL as data access levels.
UI Component
The UI has been built as a single-page application with a React library. It is the starting point for end users to observe and manipulate the gathered event data. The user interface allows users to go through predefined reports, apply various filters to the overall data, copy reports and rename them to keep an eye on them later. The D3.js library has been utilised to display data with bar, stack, line, pie and other types of charts, including Sankey diagrams, to show users’ paths in the application.
The diagram of the system’s final components looked like this:
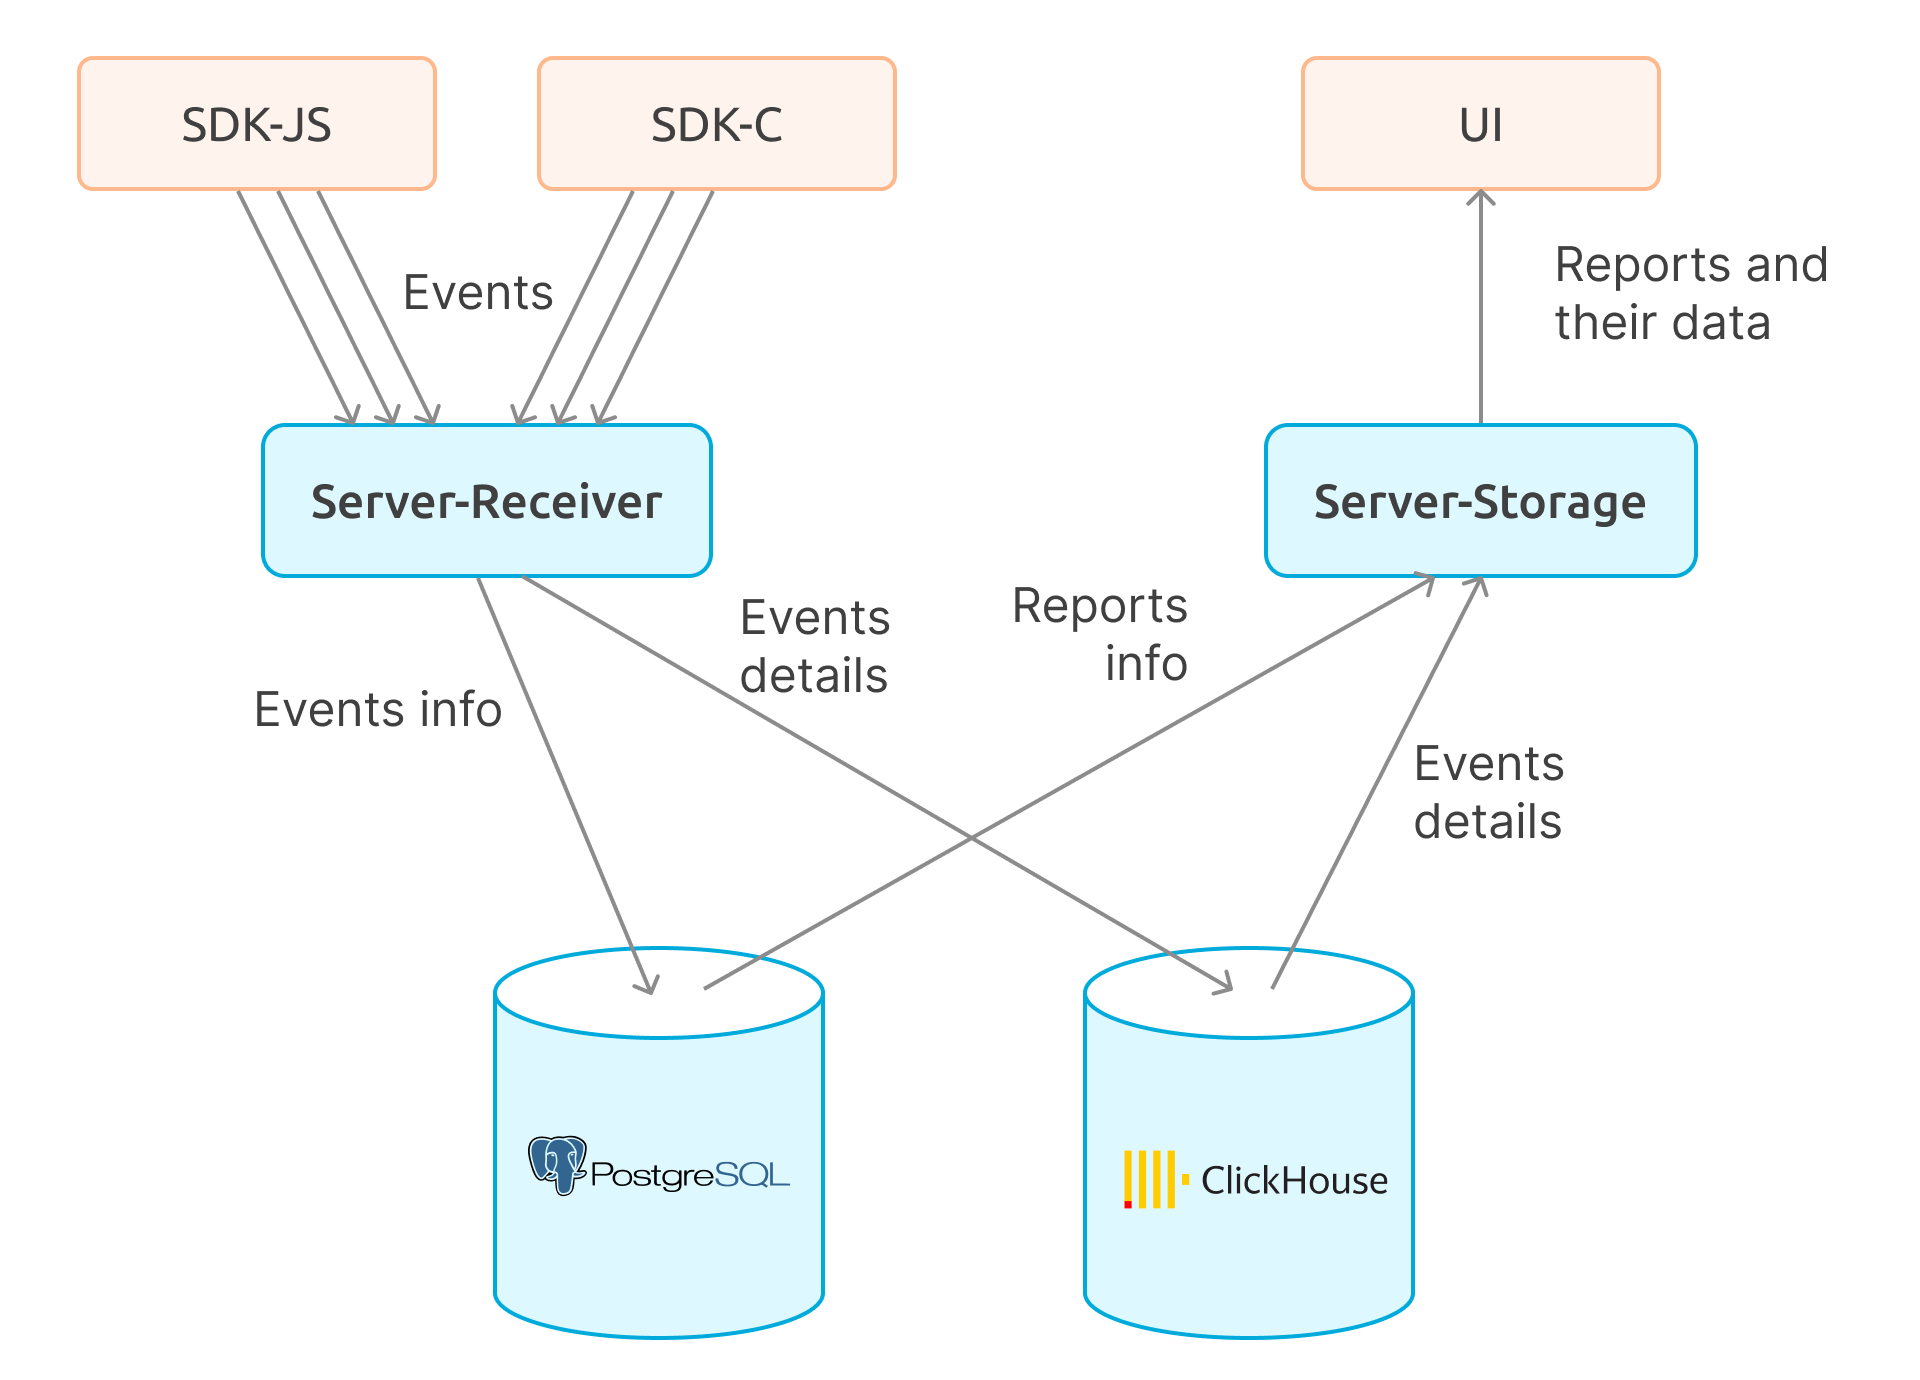
We have created a heterogeneous system to be used on-premises by the customers. It consists of several client- and server-side components to support the entire data flow. The system supports versioning and is delivered using Docker. The scalability level was confirmed using performance and stress testing.
Related Cases
Read allRTSM Solution: Data Ingestion Improvement
Removing issues in data architecture and processing in order to provide a solid foundation for future growth of the platform.
LMS Content Import and Export Feature
A solution for importing and exporting content from / to Moodle and IMSCC platforms.
Content Generation with Copilot Studio and MCP Servers
A solution to help new teachers rapidly adapt to the educational system while providing easy access to the existing content base.