People Counting and Traffic Analysis System
Our client provides a complex solution for people counting and traffic analysis, consisting of 3D or Wi-Fi sensors and a web-based platform. The system is used to measure customer traffic in retail chains, shopping malls, public institutions, and many more.
Every business with a physical space can derive significant advantages from using traffic analysis technology. Accurate footfall measurements allow you to:
- increase conversion rate
- improve staff scheduling
- redistribute traffic
- measure marketing effectiveness
- boost customer satisfaction.
Therefore, the more analytics on customers’ shopping behaviours is available in the people counting platform, the more invaluable asset it becomes to companies.
Taking this into account, our client needed to extend its platform with new sophisticated data reports and improve the quality of software architecture using more advanced technologies.
We have been involved in the development of the client’s application for several years. The first phase of our collaboration included rewriting the web platform using ASP.NET MVC. We were also in charge of developing the UX design of the platform several years ago.
Some time back, our team and the client jointly decided to build a new version of the software with .NET Core technology and a modern UI framework Vue.js. This shift allowed us to create a modern lightweight application with a simple yet powerful user interface.
We have also implemented a number of user-friendly reports to meet the needs of our client. Here are just a few of them:
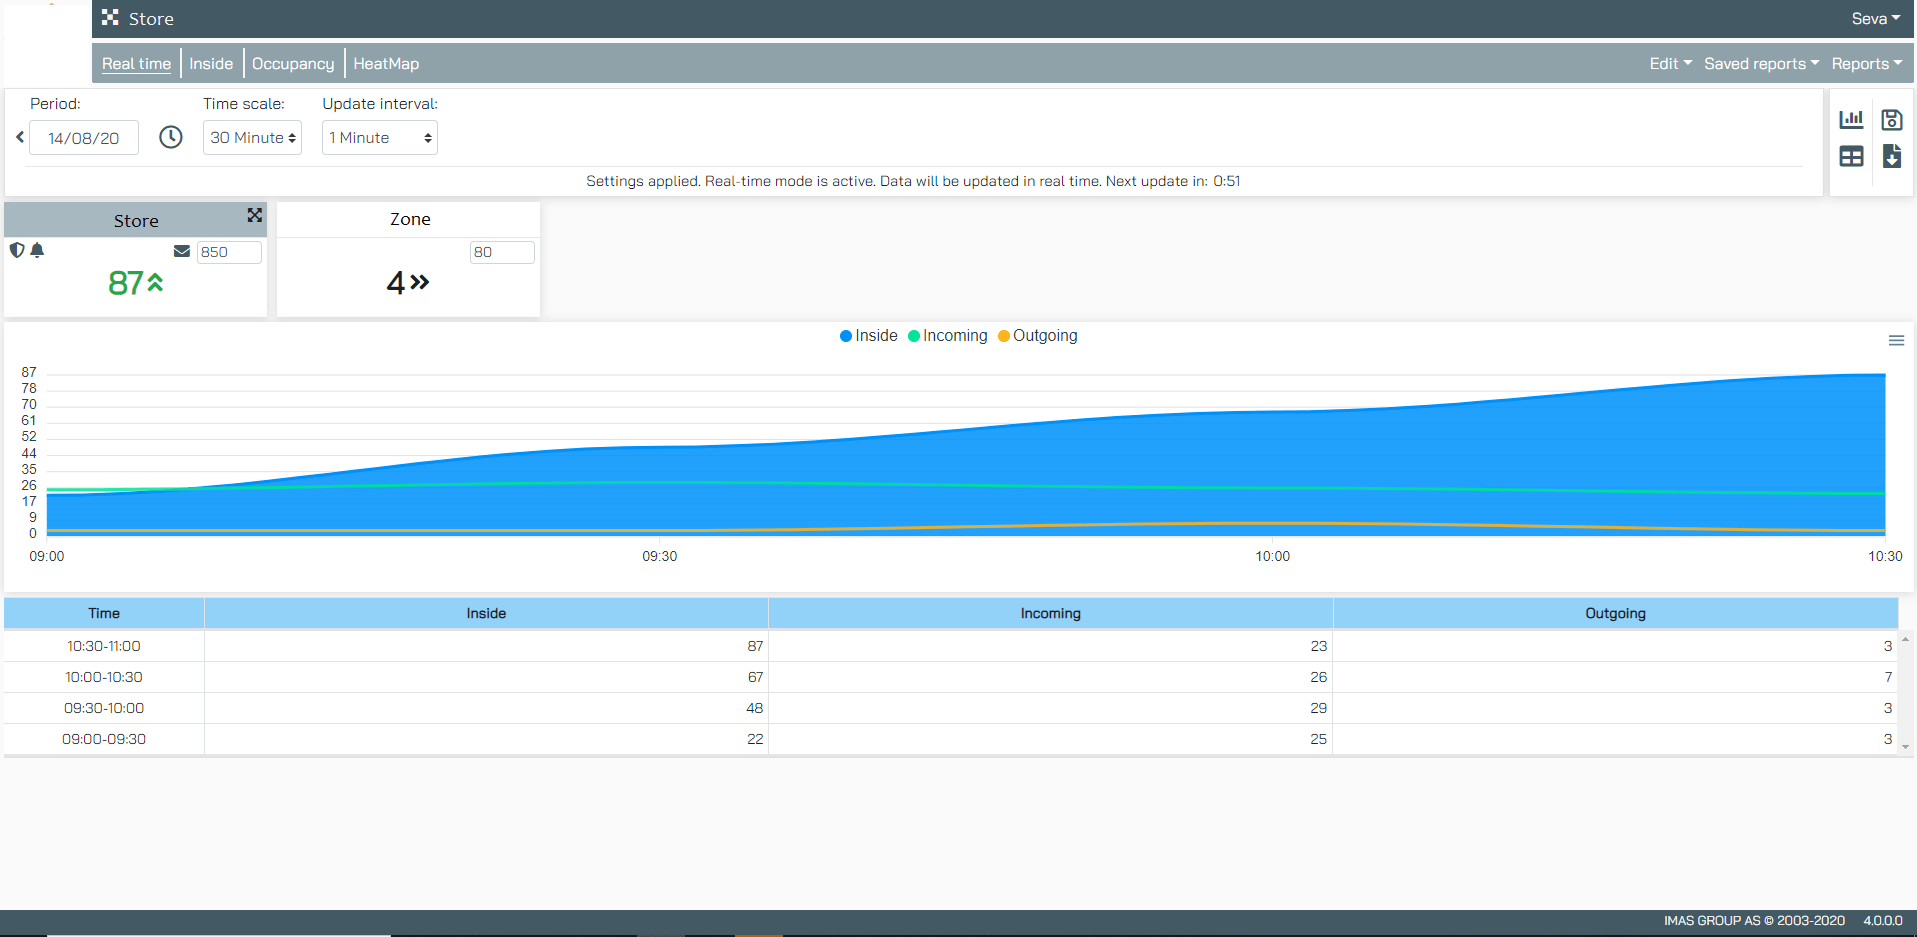
Real time report
The report displays visitor traffic and occupancy in real time. The alerting system can be activated if the occupancy exceeds a predetermined threshold.
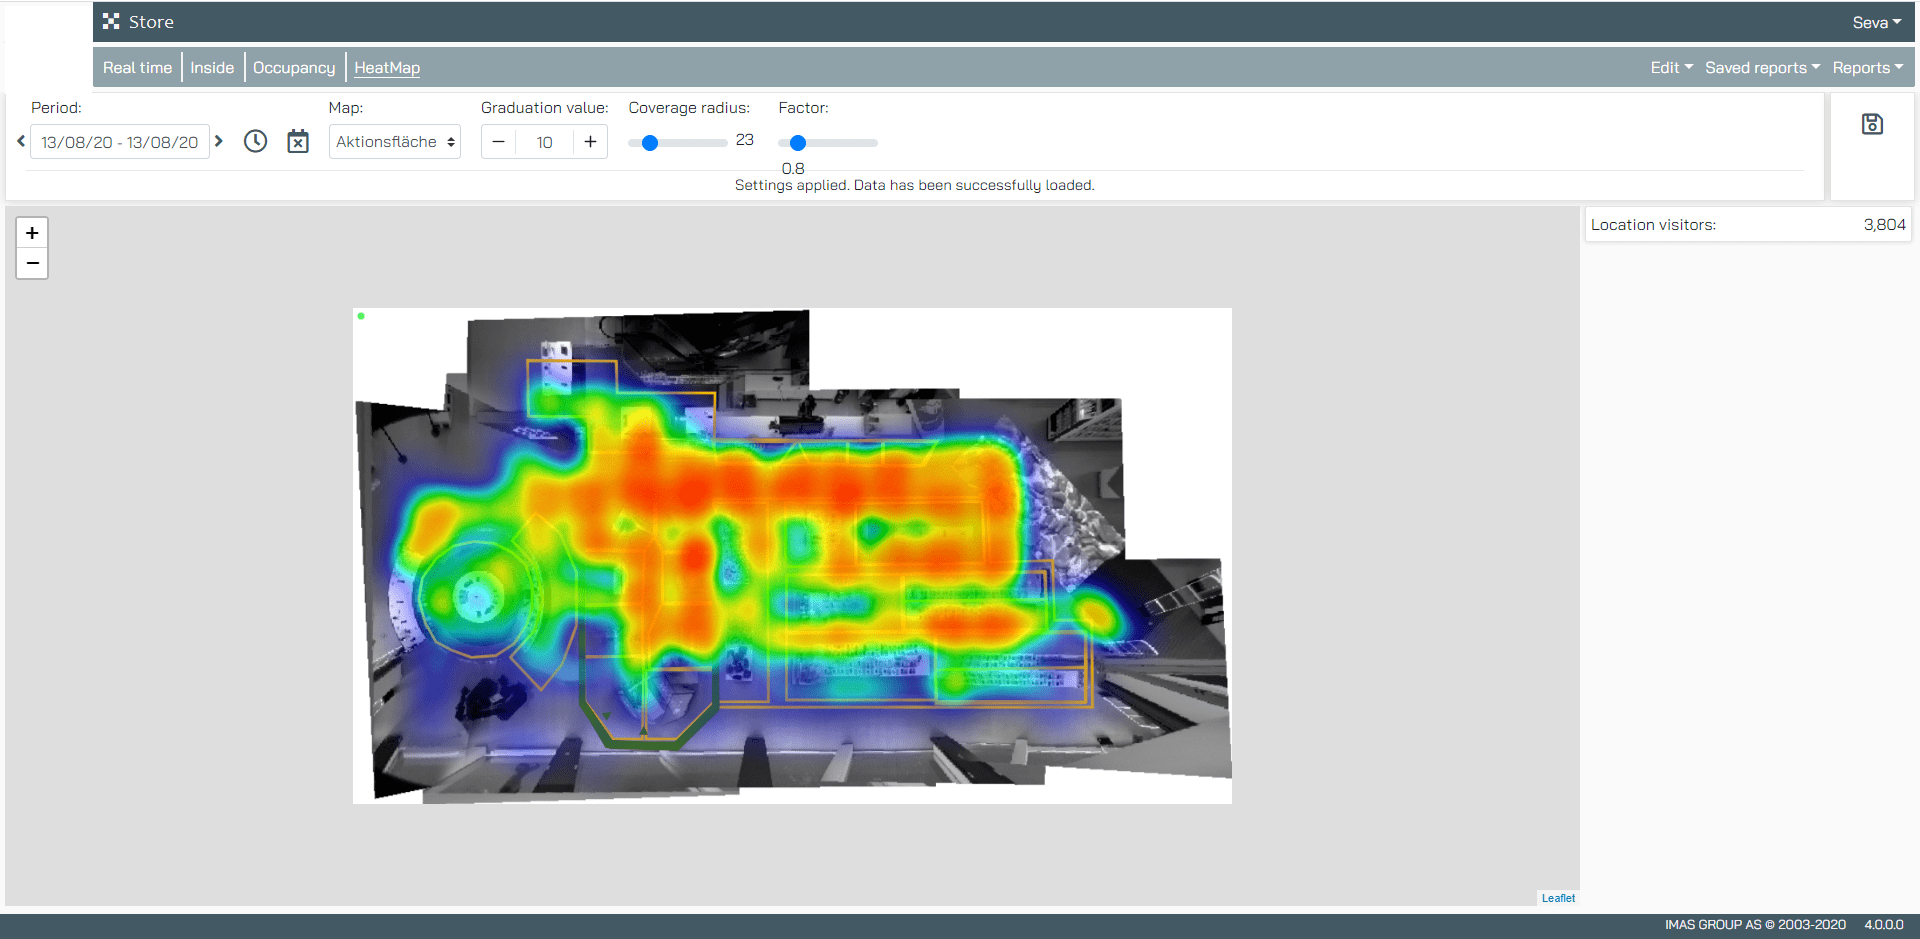
Heat map report
Heat map solution shows how many shoppers passed from any point of the store, where they stopped, and helps identify overloaded and more walkable areas.
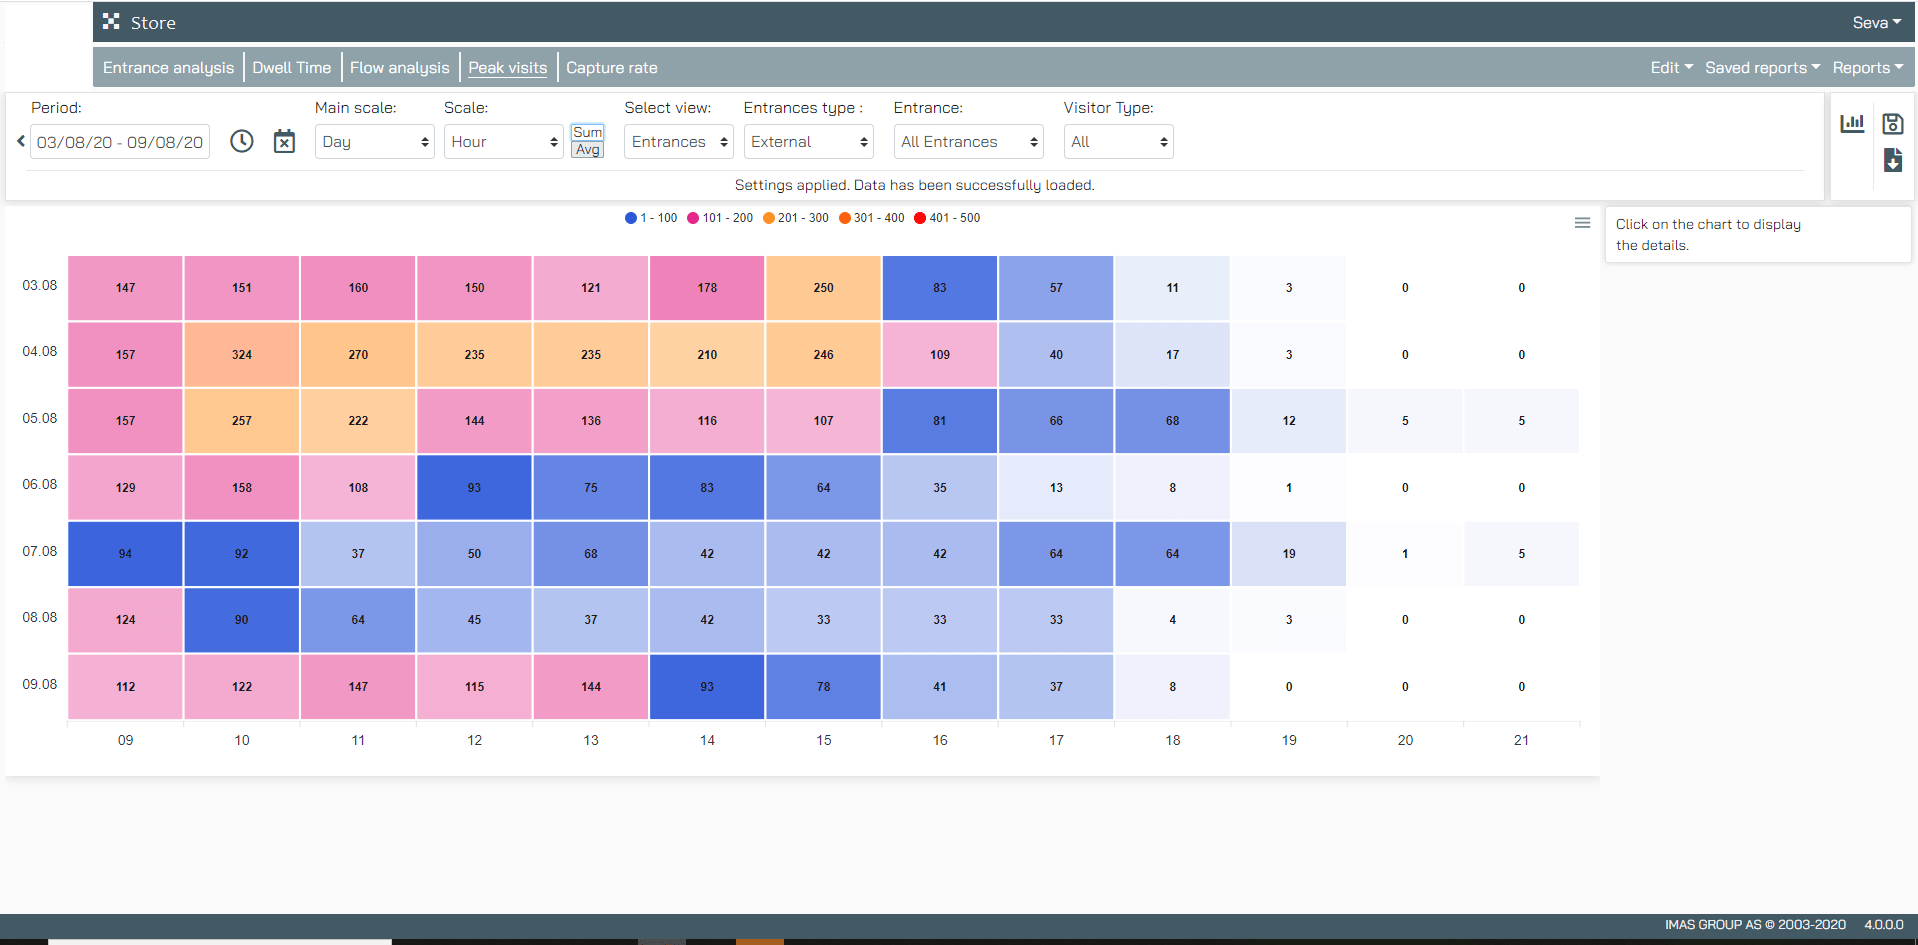
Peak visits report
Shows periods in which the stores receive the most traffic and have the biggest sales opportunities.
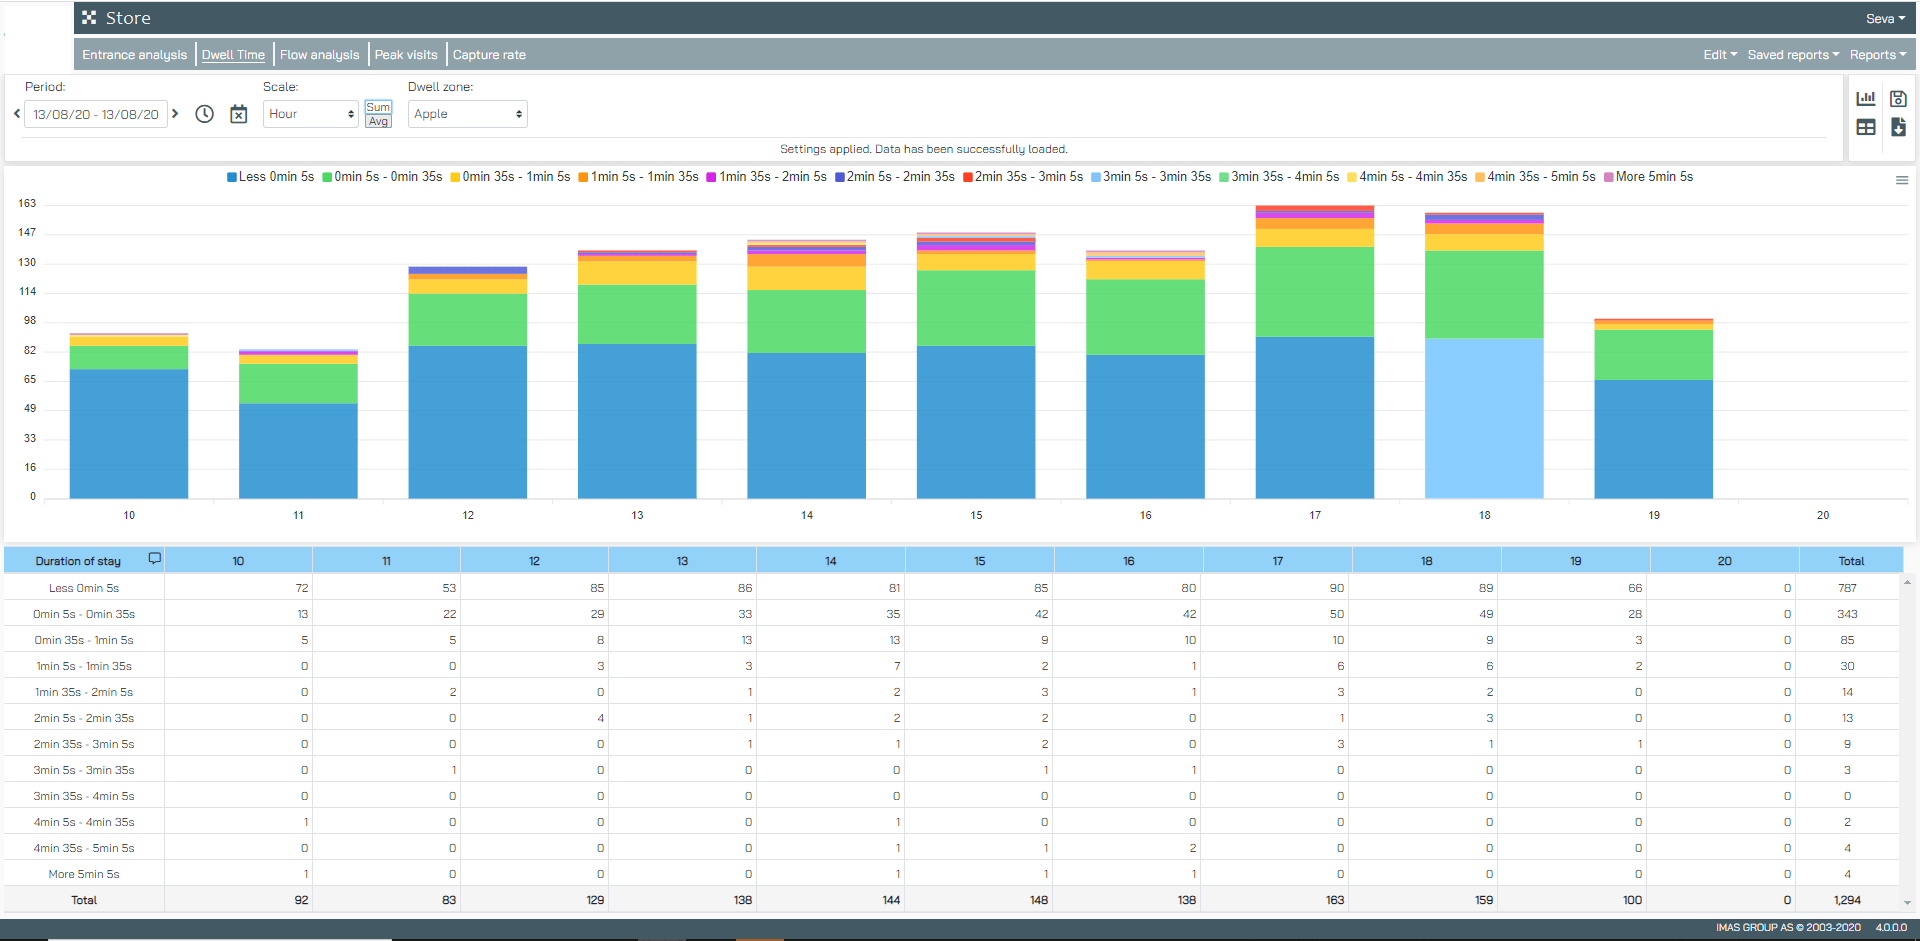
Dwell time report
Shows the amount of time customers spend in a specific zone, which helps identify the best- and worst-performing areas of the store.
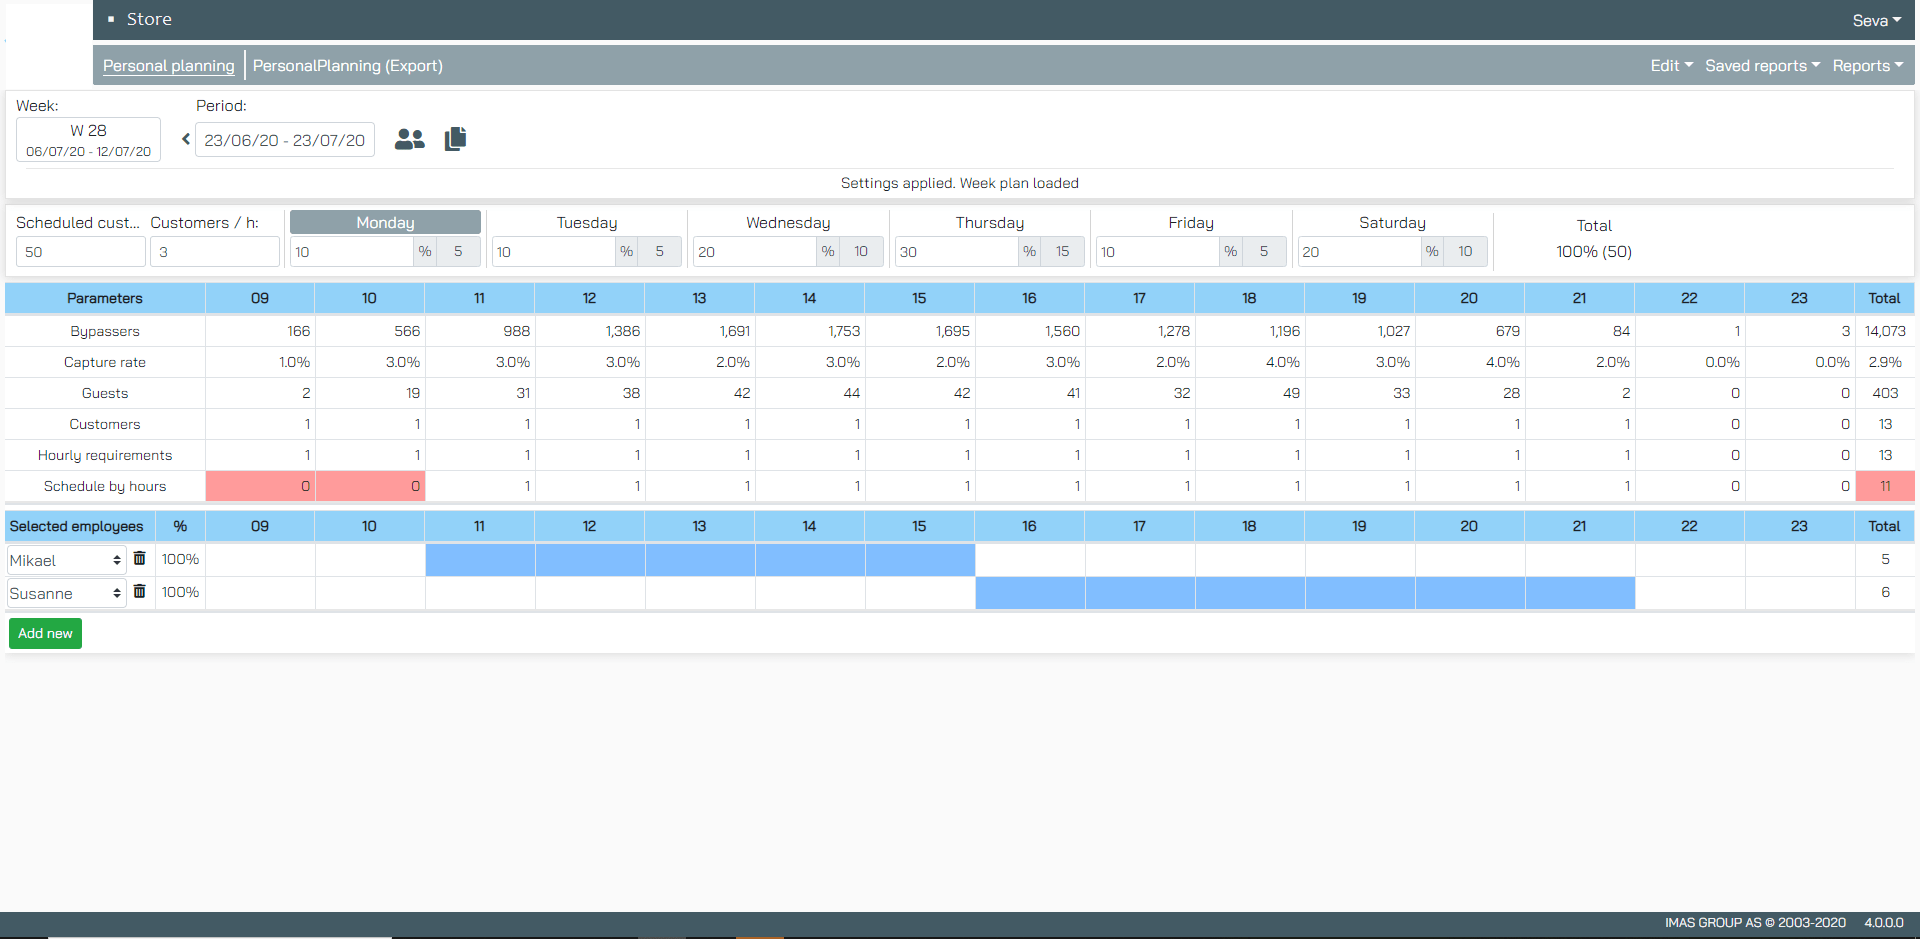
Personnel Planning
Allows the client to plan the working hours of their employees.
Software Country's team was fully responsible for UX design, graphical design, implementation, testing, and deployment of the application.
Our developers have built a web platform with more performant technology, created UX, and extended functionalities that cover the needs of almost any type of company. This web application allows users to collect and understand valuable information about customers and make better business decisions.
Our cooperation with the client continues as we keep improving the platform.
Related Cases
Read allRTSM Solution: Data Ingestion Improvement
Removing issues in data architecture and processing in order to provide a solid foundation for future growth of the platform.
LMS Content Import and Export Feature
A solution for importing and exporting content from / to Moodle and IMSCC platforms.
Content Generation with Copilot Studio and MCP Servers
A solution to help new teachers rapidly adapt to the educational system while providing easy access to the existing content base.